The first thing you need to do is download a copy of Wireshark. You can get a copy at SourceForge.net. If you are running windows, you want to Wireshark-setup file. The newest version is usually the best option.
Go ahead and find the file that you downloaded and run it. Install everything that it comes with. WinPcap is a driver that Wireshark needs in order to run. It will be automatically installed when you install wireshark. You can find more information about WinPcap at winpcap.polito.it.
Now that we have Wireshark installed lets open it up, so I can show you how to use it. Wireshark should have made a folder somewhere in your start menu called Wireshark. Go ahead and run Wireshark.
Wireshark is pretty complicated, but don't worry too much. We are only going to take baby steps.
Wireshark lets you "see" the data that is traveling across your network. You can "see" what ports a program is using. You can basically see all the traffic on your network. You can see what comes in and what is going out of your router. You can see so much that it becomes a problem. You end up getting too much data. To fix this Wireshark comes with two very useful filters that we will go over here. The filters allow you to sort the traffic that you have captured making it much easier to read. Well lets start by clicking the Capture link at the top of your screen. Then click Options in the menu that drops down.
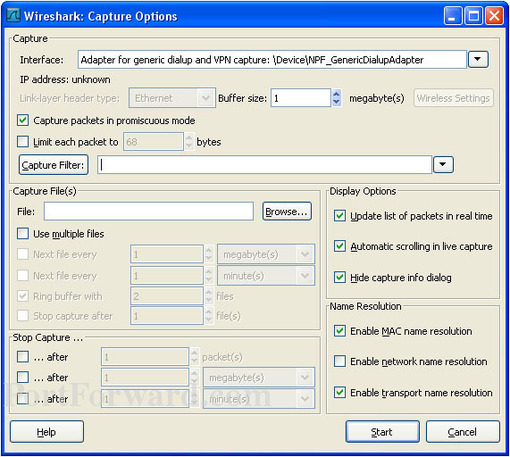
This is the window that allows you to define how to start capturing data with Wireshark. You can use the Interface drop down box to select which network card to capture data from. There will only be one option here, if you only have one ethernet card. Later on we will modify this page a bit. Now we need to tell Wireshark what to capture. Click on the Capture Filter button.
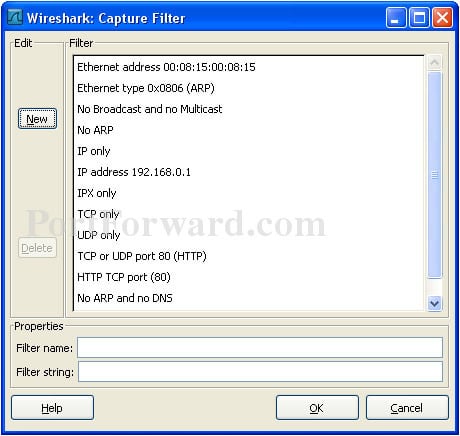
Put First Capture Filter into the Filter Name box. I want you to enter host followed by your ip address into the Filter String box. If you ip address is 192.168.1.2, the Filter String box would contain the following.
host 192.168.1.2
We are telling Wireshark to capture everything coming from and going to your ip address. So we will get a log of all the traffic that is coming from or going to your computer. When you have finished those two changes click the Ok button at the bottom of this page.
You should now be back at the Capture Options window. Then click the Start button at the bottom of the screen.
You are now see packets as they are being sent to and from your computer. You might see a lot of traffic or just a little traffic depending upon how much is going on on your network. If you do not see any packets, try opening up a web page. If you still do not see captured data, then you probably have the wrong Interface selected on the Capture options window. When you have a couple packets, click the Capture option at the top of the screen and then Stop option in the menu that drops down.
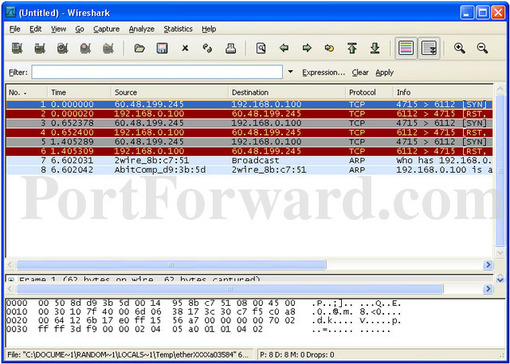
Wireshark has captured some data as you can see on your screen. There are three frames here. I have labeled them as Frame 1, Frame 2, and Frame 3 in the picture above. Frame 1 shows you an overview of what packets came in and when out of your network. Frame 2 shows more detailed information about a selected packet. Frame 3 shows the hex data of the packet. We only really care about frame 1. The source column tells us where the data was coming from and the destination column tells us where the data was going to. Both of these columns will always have ip addresses in them. The protocol column tells us what protocol that packet was sent with. Which is useful when trying to figure out what ports/procotols a program uses. The info box contains the information that we really need. The info box lists specific requests made over the network. It also lists what ports the data traveled on. Notice that every time a port is listed it is listed as a pair of ports. Data always travels on ports. It is send out of the source ip address on a port, and then received on the destination ip address on a port. These ports are rarely the same. Keeping that in mind, it is easy to see why there are two ports listed in the info box. The first port is the source port. Notice the > which you can think of as the word to. From the first port > to the second port. I hope that I have explained enough to give you a general feel for the program. Check out the help section of the program for more capture filter options. Notice that there is also a filter box above the data you have captured. This is the dISPlay filter. It works like the capture filter, but allows you to filter data that has already been captured. Click the help button in the dISPlay filter window for examples of how to use it.
Good luck!